A few weeks ago I published "My Favorite Web Features of 2019". There, I promised I'd follow up with a DevTools version of the same concept. Well, here we are!
The structure of the post will be the same. I'll start from my least favorite (but still good) to my most favorite DevTools features that have been introduced to the Firefox and Chrome developers tools in 2019. This is not a list of all introduced features, just the ones that stood out to me.
Good New Features
Chrome: Visualize layout shifts
A tool that will help you visualize how content jumps around in the page as assets load. I don't have much else to say about this. Although I haven't used it yet, I know this feature will be invaluable whenever I have to do this kind of optimization, so I'm keeping it in the back of my mind.
Firefox: CSS Flexbox Inspector
The Flexbox Inspector allows you to examine CSS Flexbox Layouts using the Firefox DevTools, discovering flex containers on a page, examining and modifying them, debugging layout issues, and more.
- Mozilla
This feature won't have too much impact on me personally, since I've been using flex for years and know my way around it by now, but I can imagine this tool being amazing for developers not very familiar with flexbox yet.
Flex can be tricky to grasp and there are a lot of standalone sites out there that aim to make it easier to understand, but having a tool for this built into the browser is still really helpful.
In general, I love it when browsers make it easier for people to get into front-end development, given how tricky and chaotic such a journey can be!
Firefox: Accessibility-related tooling
- Color Contrast in Accessibility Inspector
- Color deficiency simulator
- Check for accessibility issues
- Accessibility Tooling playlist on Mozilla Developer's YouTube channel
- Auditing For Accessibility Problems With Firefox Developer Tools
It's really great to see so many accessibility-related features land in Firefox in a single year! It's clear that the Firefox team has been prioritizing accessibility; they're taking it very seriously.
In general, I would say that accessibility tools across browsers leave a lot to be desired. There's a lot of room for improvement. This is a huge problem, because it makes for a high barrier of entry to writing accessible applications.
I think we can partially blame the current state of developer tooling around accessibility as the primary culprit for not having more accessible apps on the web today.
What I like about Firefox is that all accessibility-related tooling is grouped under the Accessibility Inspector tab, making it easier to find everything related to accessibility in a single place. It also has some features that Chrome doesn't have.
Chrome's equivalent of the "Check for issues" feature is Audits > Accessibility > Run Audit, tucked away in a different part of the DevTools interface. It's difficult to discover, particularly if you are expecting the Accessibility tab to have everything you need. It hasn't. There's no mention of color contrast, for example.
In my opinion, Chrome needs to redesign the UI/UX around accessibility features in their DevTools. Firefox's UI/UX is better here. I'd probably switch to it when I have some serious accessibility auditing to do.
Chrome: Code Folding in the Sources and Network tab
A super simple feature that's very useful. There's not much to elaborate on here, other than saying that it was long overdue.
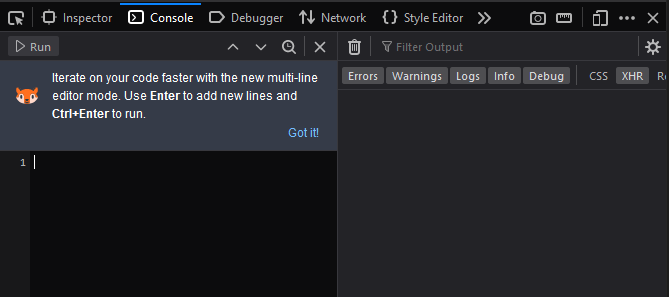
Firefox: Multi-line mode console

The fact that Chrome hasn't implemented something like this yet is astonishing, because this is just so useful! It's generally very annoying when you have to Shift + Enter something that's more than one line long. I accidentally hit Enter without pressing Shift all the time, and then I have to start over 🤦♂️. Ugh!
Great New Features
Chrome: Highlight all nodes affected by CSS property
Hover over a CSS property that affects a node's box model, such as padding or margin, to highlight all nodes affected by that declaration.
– Google Developers
This is another very simple feature that adds a lot of value. Being able to directly visualize this in the browser can make a big difference when working with layouts. If this feature were taken out tomorrow, I'm sure that a lot of us would struggle to adjust back.
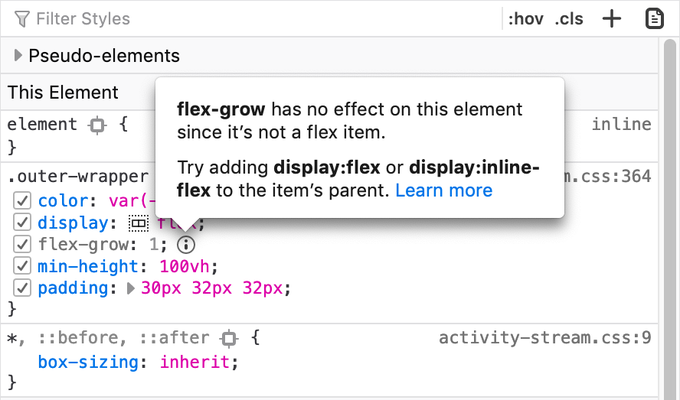
Firefox: Inactive CSS
The Inspector now grays out CSS declarations that don’t affect the selected element and shows a tooltip explaining why -- and even how to fix it.
– mozilla.org

The "how to fix it" paragraph is what I love the most about this feature. CSS declarations aren't always applied, because the developer made some wrong assumptions. It can be hard to figure out what's going on, and it usually involves some time-consuming experimentation, investigation, and context switching.
Having this feature available can be more valuable than you think, and it can make a big difference for beginners learning CSS. Check out this video demo:
Fantastic New Features
Firefox: New "Changes" tab for CSS
Firefox added a new "Changes" tab to their developer tools that allows the user to see a diff of CSS changes made through the Inspector in the current session. This is great when you're tweaking a design in the browser and want to know what you've changed, so that you can take back those changes to your stylesheets.
This is an extremely common practice for front-end developers and it's very annoying having to keep track of those changes mentally. You'd often find yourself trying not to make too many changes, so that you don't forget them when you return to your code. I've wasted so much time in the past taking care of this manually. Because of this feature, not anymore!
Here's a video demonstration of how it behaves:
Chrome has a similar feature, but it's not as user-friendly, discoverable, and easy to use as it is in Firefox, so I'm going to be whipping out a Firefox instance when I have a lot of CSS changes to make.
Chrome: Inline breakpoints in the breakpoint pane
Finally! This has been a pet peeve of mine for years, especially since Promise-based asynchronous code and inline arrow functions became so popular in recent years.
Not being able to surgically insert breakpoints at specific parts of a multiple call single statement makes it so difficult to debug these kinds of programs. So much so that I developed the habit of splitting up these calls as much as possible and always favoring explicit over implicit returns when writing arrow functions, just for the sake of making it easier to insert breakpoints and debug later.
This is something that I use every day and that's why it is so high on my list.
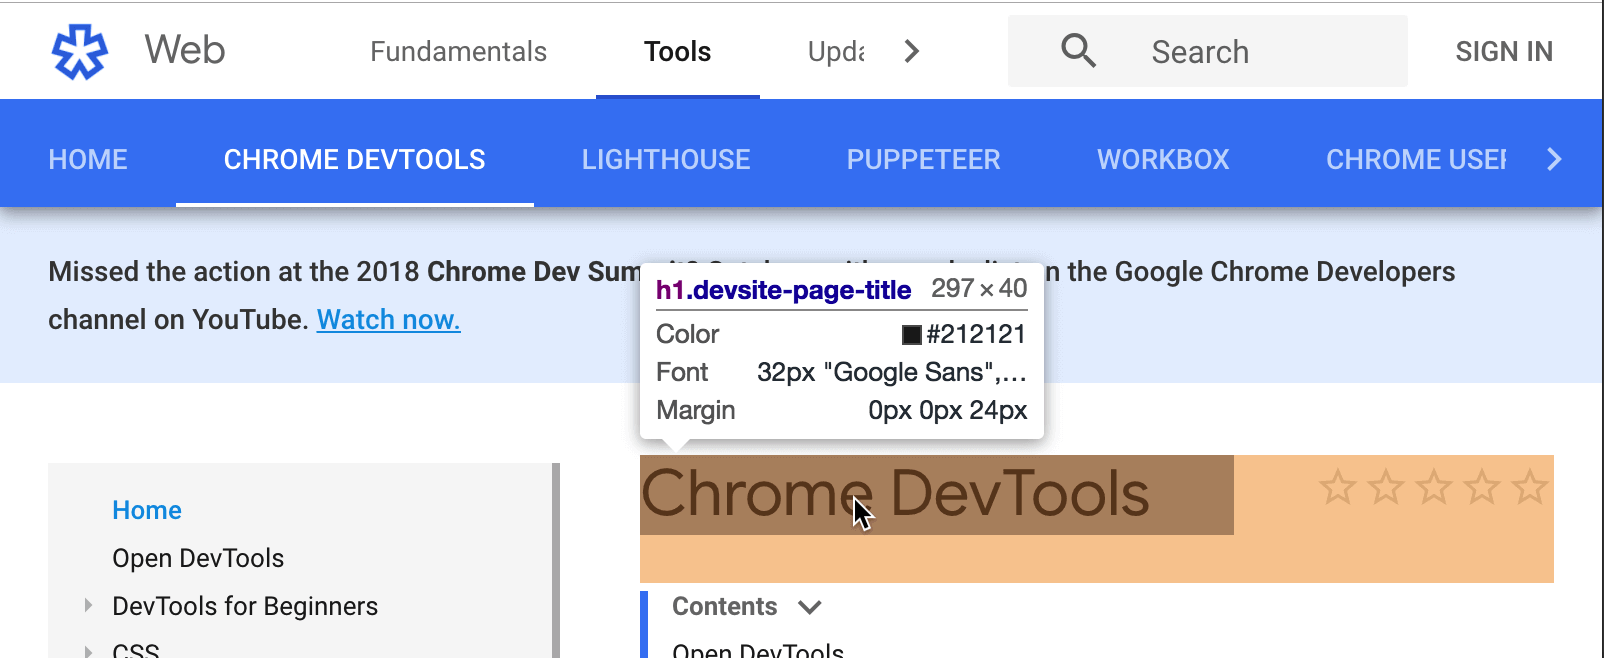
Chrome: Detailed tooltips in Inspect Mode

When my instance of Chrome auto-updated, I noticed this within the first minute. This is such a simple change and I feel like it brings so much value. Having this information pop up right away, when hovering over elements, has been more useful to me than I thought.
This being said, I appreciate that there's a certain development workflow that wouldn't benefit from this much. It all depends on what you are working on and how you are working on it.
Chrome: Autocomplete with CSS values
A feature that allows you to only type the CSS value of any given rule, instead of the property name, and DevTools will provide you with auto-complete. This takes another load of your mind when styling in the Inspector.
After years of doing front-end development work I still don't remember the box-sizing: border-box; combination on the spot. I usually have to do some context switching and quick Googling before coming back to my app, so the first time I tried this after this feature was introduced I was ecstatic. It's the simple things...
Chrome: Logpoints
Oh boy, I saw this feature in the release notes for Chrome 73 in January and knew 2019 was going to be a good year. No more console.log all over the place in your codebase (and then having to remove them all). Not only that, but it also eliminates having to do changes to your app, waiting for it to recompile, and then refreshing the browser for those changes to take effect.
Not to mention when you had to do logging-related debugging in production apps where you just couldn't change the source that is running to add console.log yourself.
This is of great value to me. It makes me wonder why it took the Chrome team so many years to implement this, especially since they've had the breakpoint editor (thanks to conditional breakpoints) already designed and working for many years.
Conclusion
So there you have it. I'm genuinely curious about what your favorite DevTools picks would be. Is there a feature that you rely on in your day-to-day that was introduced last year that I haven't mentioned? Or that I mentioned but that's not as high as you might expect? Maybe there was a really good new feature that I missed entirely. Let me know in the comments!
TABLE OF CONTENTS


