
We’ve been developing games with Unity for a while. As most of our games are targeted for mobile devices, one of our main concerns on the development process is having our projects well structured and optimised.
There are a lot of simple tips and tricks we’ve been using which make all the difference for any project’s overall performance.
In order to demonstrate each topic’s usefulness, I’ll be presenting profiling data retrieved from a demo, running on an iPad Mini.
Cache Component References
Always cache references to components you’ll need to use on your scripts.
Accessing a game object world position from its script is easy, all you need to do is call transform.position. The problem is that this comes at a price.
When accessing transform, renderer or other built-in component getter inside a class, it’s internally calling GetComponent () which is slow.
I’ve created a simple demo where 800 boxes are moving around and bouncing with each other. Their movement is done by directly updating their world position on the* Update()* method.
I’ve added a switch which controls where each box uses either transform.position directly or a previously cached transform variable.
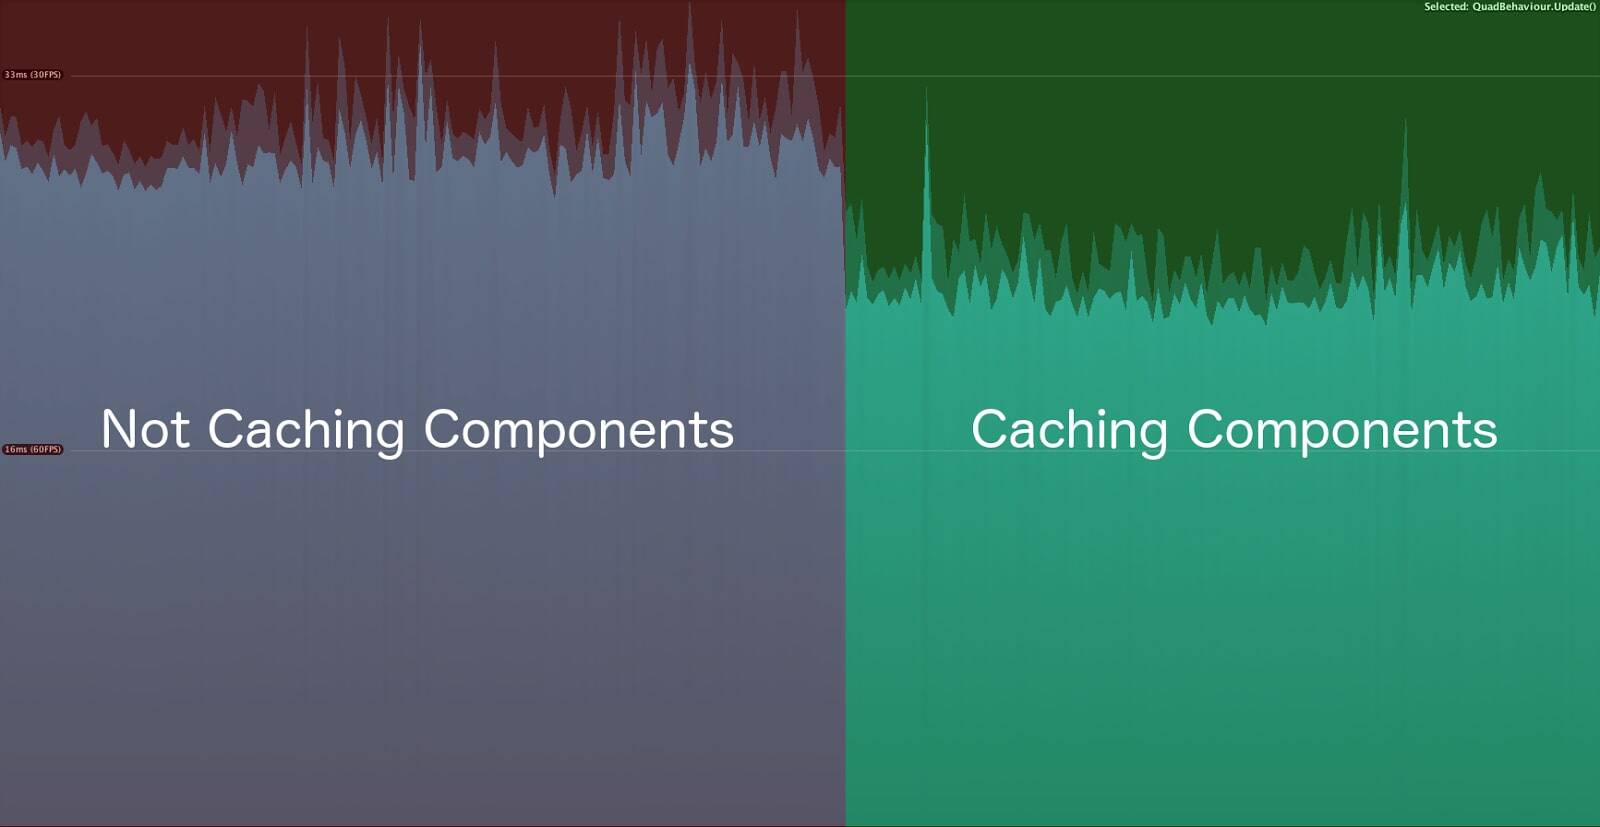
Figure 1 – Caching Components
Without caching components, we get an average of ~30ms spent on scripting, as with caching we decrease that value to around ~23ms.
You need to add a couple of extra lines on your scripts to cache each one of the components you’ll need to use, but as you can see from the profiling data, it’s totally worth it.
Cache Objects References
Always cache object references when you need to access objects from the scene. GameObject.Find(…) is very tempting to use but is also very, very slow.

Figure 2 – Using GameObject.Find(…) vs Cache Reference
It’s very clear the impact it has on the overall performance just by looking at this image. In the demo, each object is communicating with a dummy manager either by using GameObject.Find(…) or a previously cached reference.
The overall script time reduces from an average of ~41ms to ~23ms just by using a cached reference.
Cache Game Objects
This is something that a lot of people ask online.
No, it’s not necessary to cache game objects; you can use gameObject directly on your script without having to worry about any impact on your performance.
In this next image I switched back and forth between using a cached game object and the gameObject itself, and as you can see, there’s no change at all on the overall script execution time.

Figure 3 – Caching Game Object
Memory Allocation
Always consider creating and using Object Pools instead of always instantiating new objects on the fly.
This will bring a lot of advantages as it will lead to less memory fragmentation and make the Garbage Collector work less.
It’s also important to be aware that the Garbage Collector will become slower as the memory usage increases because it has more memory to scan to find and free unused data.
From Unity’s official documentation, the GC on an iPhone 3 takes about 5ms on a 200KB heap size as with a heap of 1MB it will take 7ms.
Also when allocating memory from a highly fragmented heap block, you most likely don’t have the amount of contiguous memory needed which leads Unity to allocate a new heap block. This leads to a performance spike as GC is forced to kick in and try to free some memory.
To better exemplify Object Pool vs On the Fly Allocation, I tweaked my previous demo a bit.
Now each time I touch the iPad’s screen, a new box is created by either allocating a new instance or getting it from an Object Pool. Each time a box collides with each other or with the screen boundaries, it will be either destroyed or returned to the pool.
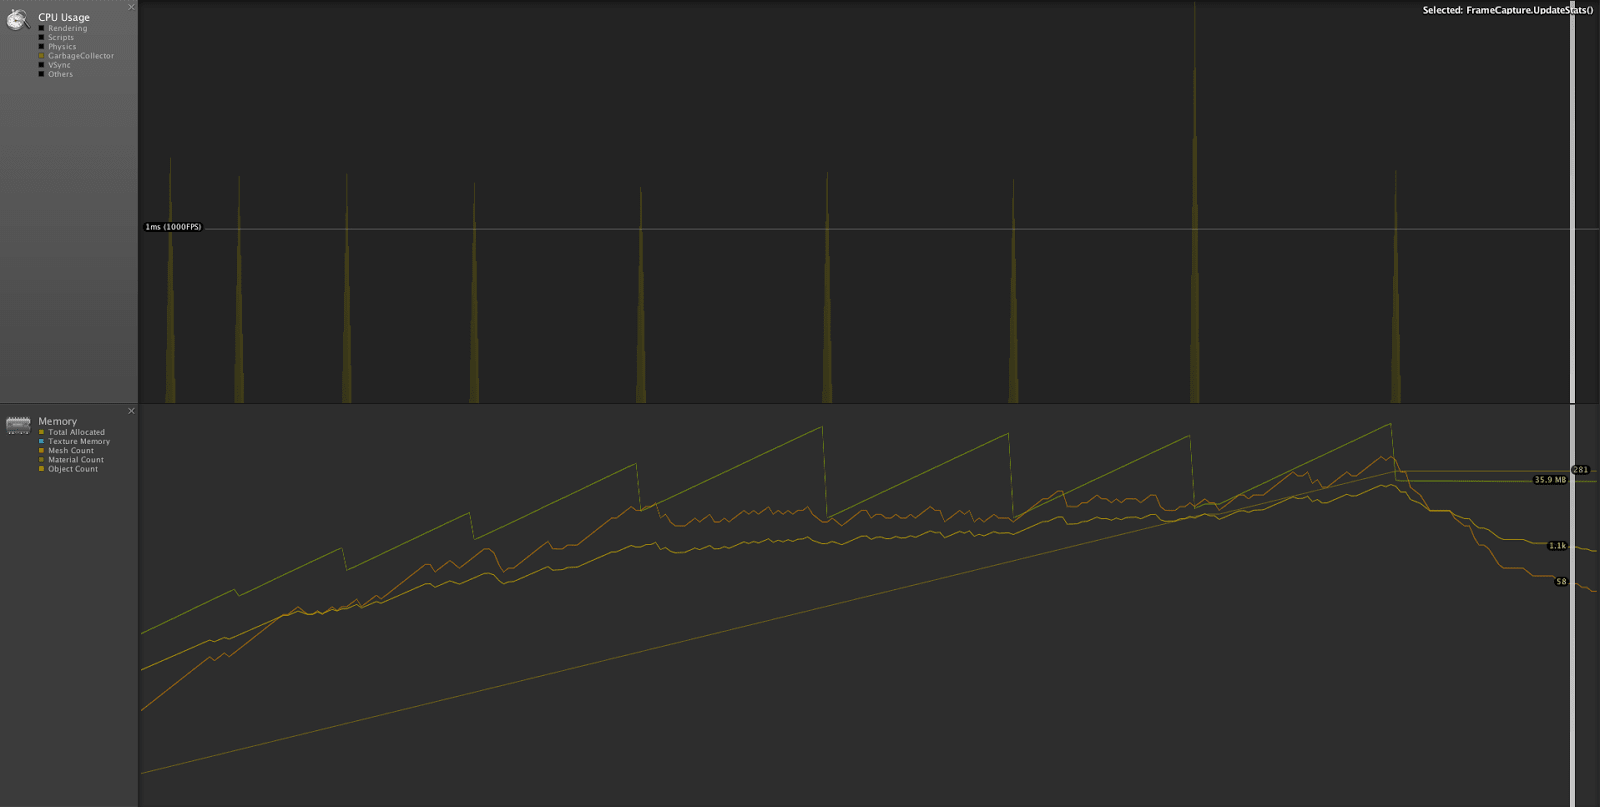
Figure 4 – Without pool usage
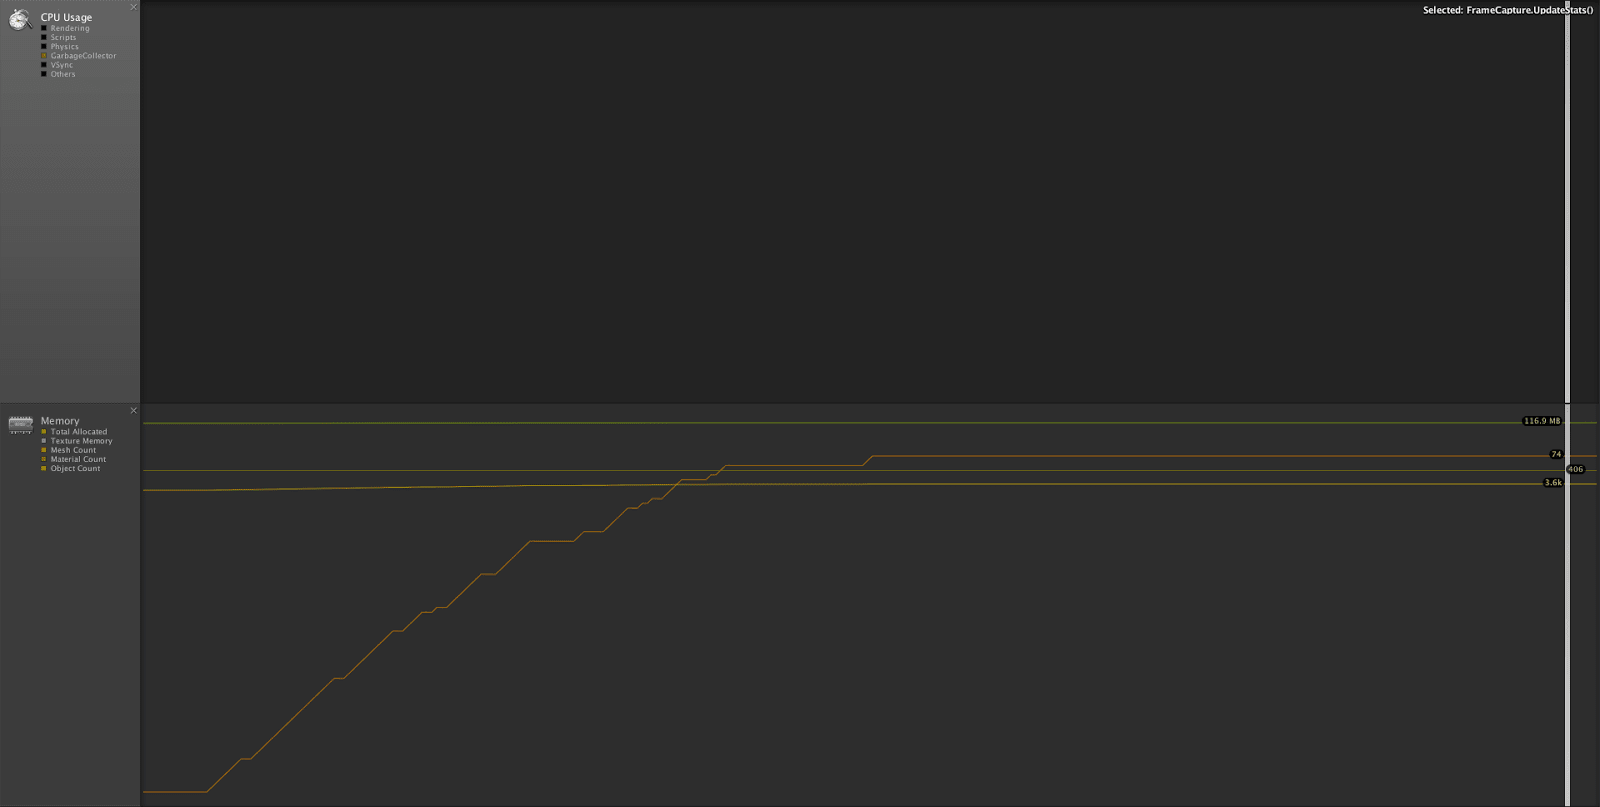
Figure 5 – With pool usage
It’s pretty clear with both these images to see the memory behavior I was describing. With a pool usage, although I need to allocate a lot of memory from the start to create the pool itself, I never have to do it again, and the GC almost never kicks in. As without a pool, Unity is always in need to allocate new heap blocks, and for each one, the GC is activated, creating a sawtooth wave pattern on the allocated memory.
This is a very simple demo on which I could easily use a pool for everything, but in a real situation, not everything can be poolable. We can, however, control a bit when the GC does its job and force it to do some cleanup by calling System.GC.Collect(), usually done when you know you have some CPU time to spare.
Sharing Materials
Unity has a neat operation called batching. What it does is combine objects that share the same material ( among other properties ) and draws them together on a single draw call.
As each draw call represents an increased overhead on the CPU side, decreasing their amount is a guaranteed boost on your game’s performance.
It’s particularly easy to take advantage of this feature when working on UI and on 2D games in general, where you store all your textures in a common atlas using a common material.
To demonstrate the impact on the number of draw calls, I’ve added a new feature on my existing demo where I can change in real time if each of the bouncing boxes are using a shared material or each has its own.
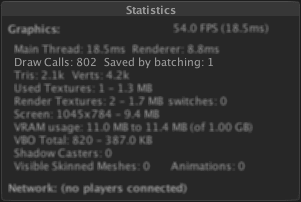
Figure 6 – Own Material (UnityEditor Stats on PC)

Figure 7 – Own Material
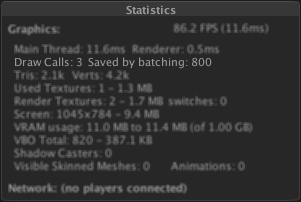
Figure 8 – Shared Material (UnityEditor Stats on PC)
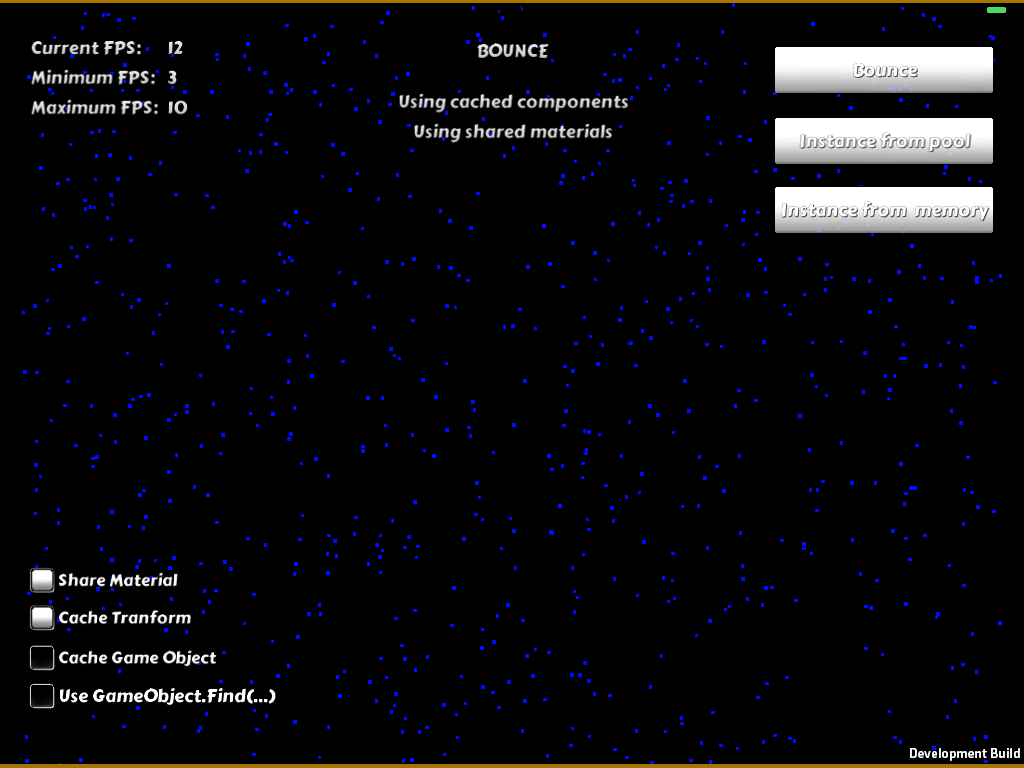
Figure 9 – Shared Material
As you can see, not using a shared materials generates 803 draw calls ( 800 for each box, and the others for UI and the screen boundaries ) and runs at ~6fps.
By switching to a shared material the number of draw calls drops to 3, indicating that all boxes are drawn in a single draw call and increasing the demo frame rate to ~12fps.
More to come, stay tuned
That wraps up Part 1. Each of these topics is extremely easy to implement from the start, and as you could see from the profiler data, they will make all the difference. Don’t leave the optimisation process to the end.
Let the CPU time be spent on where it really needs to be.
SHARE:


