

Scientists, in general, need data to make decisions, or at least to make the right decisions. They analyze behaviors, patterns, fluctuations, specific information like demography, environment, and so many other variables that can affect a specific amount of people, situation, or object.
We as computers scientists are no exception. The life of a developer or someone related to any computer science field revolves around making decisions of many kinds. For example, we can think about how to structure a project, which design patterns to use, which algorithm fits better for each case, etc.
So why do we need to measure things?
When conversation boils down to improving the user experience, people need data about how the users behave in our app. We would like to know how much time a user spends on each of the screens, which buttons the user clicks often, how well we are retaining users, what is our userbase age-range, where they are from…
In this article, you will learn how to capture all those valuable information and how to visualize them to make your decisions. So, let's get started:
Set Up the Environment
To collect our data, we need to install the Firebase SDK in the project. This is an easy peasy step using gradle; refer to the docs to learn how to do that. Now, we need to set up the analytics library:
First, add the dependency to your gradle file:
implementation 'com.google.firebase:firebase-core:15.0.2'
Declare the FirebaseAnalytics Object in your Activity:
private var mFirebaseAnalytics: FirebaseAnalytics? = null
Initialize the object in the OnCreate method
// Obtain the FirebaseAnalytics instance.
mFirebaseAnalytics = FirebaseAnalytics.getInstance(this)
Everything is set - easy, wasn't it? Now, we move to the next step.
Note: you can follow the official Get Started guide here: Add Firebase to Your Android Project
Log the Events
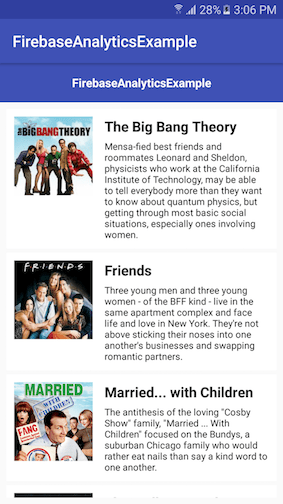
You will use the FirebaseAnalytics object to submit all the events you would like to track in your app. As an example, I have created a simple list of TV Shows with hardcoded data in it:
Lists are everywhere; is difficult to imagine an app of more than three screens that doesn't contain a list. Therefore, this is a very common situation. If we offer multiple options, we would like to know at least the three most popular items and the three least popular ones. We can easily achieve this by tracking the event:
We first add all the data we want to track to a Bundle object:
val bundle = Bundle()

bundle.putString(FirebaseAnalytics.Param.ITEM_NAME, tvShow.name)
Then you call the logEvent method of the FirebaseAnalytics object:
mFirebaseAnalytics?.logEvent(FirebaseAnalytics.Event.SELECT_CONTENT, bundle)
As you see in the previous snippets, FirebaseAnalytics has some built-in identifiers for the parameters and for the event itself. In this case, we are using the parameter name ITEMNAME and the event name SELECTCONTENT; we can, of course, use our own identifiers, for example:
val bundle = Bundle()

bundle.putString("show_name", tvShow.name)

mFirebaseAnalytics?.logEvent("show_selected", bundle)
In this case, we used our own custom names show_name for the parameter and show_selected to identify the event. You can add as many parameters as you want, depending on your needs. If you don't see anything on the console right away, don't panic - it takes around 24 hours to refresh all the events.
And that's all, folks! I hope I helped you at least a little; now go ahead and track helpful things to get valuable insights into what your users really need and want.
The source code of this app can be found in my GitHub.


