A short horror story. You have an app that includes multiple APIs, several sources of information, asynchronous tasks, Lambda functions, and more. One of your clients just sent you an email saying they had a problem with the app.
So you turn to the logs of the Docker containers that run your services. After a while, you discover that the error came from a Lambda function. So you turn to Lambda logs. After a while, you discover that the error came from an API that the Lambda function called. So you turn to your API logs. After a while, ...
I can go on. It's a messy situation that I'm sure every software developer has encountered at some point in their career. Thankfully, there's a solution to these logging inefficiencies, and it comes in the form of Fluentd, Elasticsearch, and Kibana. FEK, in short.
FEK allows you to centralize your logs with a graphical tool, advanced filters, dashboards, and more, so you have an easy way to index and visualize all your logs. In this post, I'll show you how to configure FEK using Docker Compose and how you can create an endpoint to call from anywhere, so your data is logged, formatted, and searchable.
Configuring Docker Compose
Configuring the docker-compose.yml file requires the following easy steps. First, create a file called docker-compose.yml and open it with your favorite text editor. Then, configure the Elasticsearch container like so (don't forget to change your password):
version: "3"

services:
  elasticsearch:
    image: docker.elastic.co/elasticsearch/elasticsearch:7.13.1
    container_name: elasticsearch
    environment:
      - "discovery.type=single-node"
    expose:
      - "9200"
    environment:
      ES_JAVA_OPTS: "-Xmx256m -Xms256m"
      ELASTIC_PASSWORD: "YOUR_PASSWORD_HERE"
      http.cors.enabled: "true"
      http.cors.allow-origin: "*"
      xpack.security.enabled: "true"
      discovery.type: "single-node"
    ports:
       - "9200:9200"
With the Elasticsearch container configured, we can configure Fluentd. First, we need to create the config file. This file will contain instructions on how Fluentd will receive its inputs and to which output it should redirect each input.
So, create a file in ./fluentd/conf/fluent.conf/ and add this code (remember to use the same password as for the Elasticsearch config file):
<source>
  @type http
  port 9880
  bind 0.0.0.0
  body_size_limit 32m
  keepalive_timeout 10s
</source>

<match *.**>
  @type copy

  <store>
    @type elasticsearch
    host elasticsearch
    port 9200
    logstash_format true
    logstash_prefix fluentd
    logstash_dateformat %Y%m%d
    include_tag_key true
    type_name access_log
    tag_key @log_name
    flush_interval 1s
    user elastic
    password YOUR_PASSWORD_HERE
  </store>

  <store>
    @type stdout
  </store>
</match
The first part of this file tells Fluentd that the input will be an HTTP request in the 9880 port. The second part says that all requests matching *.** (i.e. all requests) will be redirected to Elasticsearch running on port 9200.
Now that we have our Fluentd config file set up, we need to create the dockerfile to build Fluentd with the Elasticsearch plugin. Create a file called Dockerfile in the ./fluentd/ folder. Inside the file, add this code:
FROM fluent/fluentd:v1.12.0-debian-1.0
USER root
RUN ["gem", "install", "fluent-plugin-elasticsearch", "--no-document", "--version", "5.0.3"]
USER fluent
Once that's done, we can now add Fluentd to our docker-compose.yml file, which should now look like:
version: "3"

services:
  elasticsearch:
    image: docker.elastic.co/elasticsearch/elasticsearch:7.13.1
    container_name: elasticsearch
    environment:
      - "discovery.type=single-node"
    expose:
      - "9200"
    environment:
      ES_JAVA_OPTS: "-Xmx256m -Xms256m"
      ELASTIC_PASSWORD: "YOUR_PASSWORD_HERE"
      http.cors.enabled: "true"
      http.cors.allow-origin: "*"
      xpack.security.enabled: "true"
      discovery.type: "single-node"
    ports:
       - "9200:9200"

  fluentd:
    build: ./fluentd
    container_name: fluentd
    volumes:
      - ./fluentd/conf/:/fluentd/etc
    ports:
      - "9880:9880"
Lastly, we need to add Kibana to our docker-compose.yml file. This is how our file should look like (don't forget about the passwords):
version: "3"

services:
  elasticsearch:
    image: docker.elastic.co/elasticsearch/elasticsearch:7.13.1
    container_name: elasticsearch
    environment:
      - "discovery.type=single-node"
    expose:
      - "9200"
    environment:
      ES_JAVA_OPTS: "-Xmx256m -Xms256m"
      ELASTIC_PASSWORD: "YOUR_PASSWORD_HERE"
      http.cors.enabled: "true"
      http.cors.allow-origin: "*"
      xpack.security.enabled: "true"
      discovery.type: "single-node"
    ports:
       - "9200:9200"

  fluentd:
    build: ./fluentd
    container_name: fluentd
    volumes:
      - ./fluentd/conf/:/fluentd/etc
    ports:
      - "9880:9880"

  kibana:
    container_name: kibana
    image: docker.elastic.co/kibana/kibana:7.13.1
    links:
      - "elasticsearch"
    environment:
      - ELASTICSEARCH_USERNAME=elastic
      - ELASTICSEARCH_PASSWORD=YOUR_PASSWORD_HERE
    ports:
      - "5601:5601"
That's everything set up. Now we need to open our terminal, navigate to our source folder, and run $ docker-compose up.
How to Index Your Logs
Indexing your logs is simple. Create an HTTP post request to http://localhost:9880. The body of this request should be a simple JSON object with key-value pairs. For example:
{
  "environment": "dev",
  "message": "your log goes here",
  "module": "user",
  "level": "INFO"
}
You can create your searches, dashboards, and everything else with those fields. Choose wisely what you log.
How to See Your Logs
We use the amazing Kibana to see our logs. Open your browser and go to http://localhost:5601. This will open the Kibana portal, which will ask for user and password. The user is elastic and the password is the one you defined in the docker-compose.yml file.
Next, open up Kibana and click Discover in the left menu bar. You'll see a screen like this:
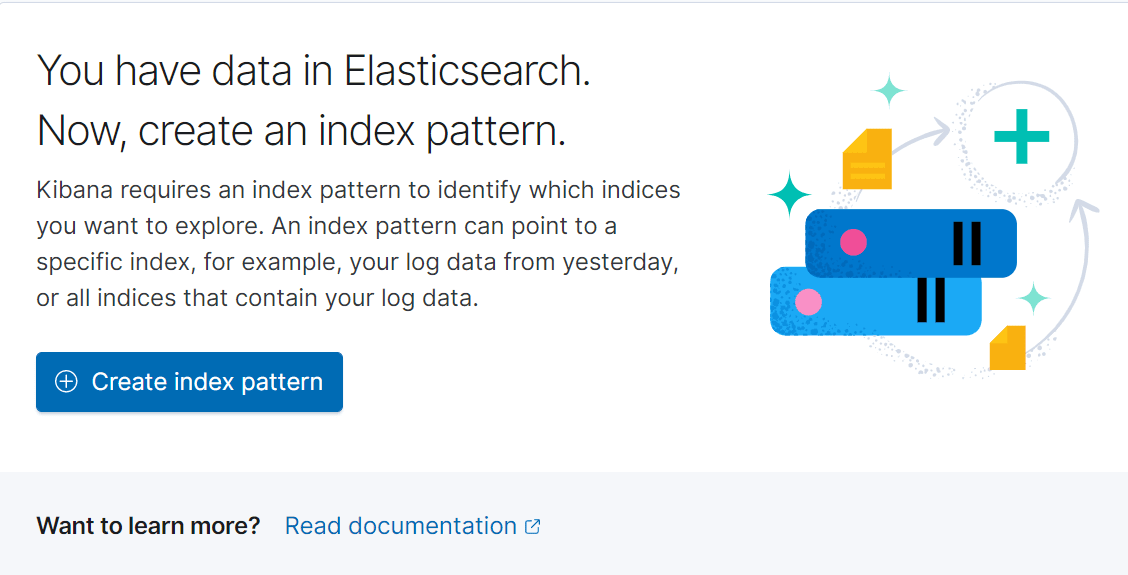
Next, click on Create index pattern. In the index pattern name field, type fluentd-. Click on Next Step. In the timefield dropdown, select @timestamp and click Create index pattern.
And it's done! Now, if you navigate to the Discover menu, you'll see your logs by period. You can use the Kibana Query Language (KQL) to create your own advanced filters (and a lot more).

And there you have it. Now that you have your containers up and running, you have taken control of your logs and have the ability to easily search and analyze them, so you can quickly find and solve your application's problems.